Wednesday, August 31, 2011
Tuesday, August 30, 2011
In the Cards

Now that SPX has met my objective of surpassing 1208, which I wrote when it was in the 1130s, here, I see a move to 1250-1260, followed by a drop to 1200, then a move to 1295ish. The circles are the points of contact along the resistance levels.
To me, this is possible because a) short squeeze territory is above 1250 b)the 200 day MA or EMA can be around 1280-1300 if and when prices reach there and c)a retracement that large before another drop conforms to the market's habit of being deceptive.
Thursday, August 25, 2011
S&P 500 Intraday Bias, 10:45 AM
Negative, suggesting the market will remain weak today. However, I think this sell off it a reaction that is part of an upswing.
Wednesday, August 24, 2011
Tuesday, August 23, 2011
Comment
The S&P seems to be forming a double bottom and may soon begin a move above 1208, perhaps today.
Monday, August 22, 2011
Saturday, August 20, 2011
In case you missed it...
Here an in article by Will Rahal on the economy, published when the S&P 500 was at 1345: The Economy: a Structural Problem.
Friday, August 19, 2011
Thursday, August 18, 2011
S&P 500 Intraday Bias, 10:05 AM
Negative, which, in today's context, indicates no positive divergence.
Wednesday, August 17, 2011
Tuesday, August 16, 2011
Monday, August 15, 2011
Sold BGU at 58.10
At 3:27PM, when SPX was at about 1200. (I originally bought in the low 1180s.)
I sold in order to play it safe, but I think 1250 is in the cards before another downturn in prices.
I sold in order to play it safe, but I think 1250 is in the cards before another downturn in prices.
S&P 500 Intraday Bias, 9:55 AM
Positive, suggesting strength will continue for the remainder of the trading session.
Friday, August 12, 2011
Wednesday, August 10, 2011
S&P 500 Intraday Bias, 10:00 AM
Neutral, no clear signal as of yet for market direction for the remainder of the trading day.
Tuesday, August 9, 2011
Failed T

The image is a follow up to the T I first presented on July 9, here. Within the first day or two of that post, I added "If this T fails, a valid interpretation is that we are in a bear market."
It's expiring right around now, so there's another nail in the coffin-- not that "were're in a bear market" isn't a widespread conclusion already.
Added: since it seems like the market bottomed short term while this T expired, would this constitute a inverse T? Looks like it, but I am not sure I completely buy into whether they exist. Just wanted to point it out.
S&P 500 Intraday Bias, 9:45 AM
Positive, suggesting buy the dips intraday. I published this early given the dip at the open.
Monday, August 8, 2011
S&P 500 Intraday Bias, 10:15 AM
The bias remains negative, implying that the market will remain weak the remainder of the day.
Nevertheless, I think there may be a bounce today.
Nevertheless, I think there may be a bounce today.
Saturday, August 6, 2011
Correction Target

Above is the NYSE advance-decline line with its 200 day moving average. On Friday, the moving average was penetrated although the line closed slightly above it. This is the first time in the bull market that the 200 day MA was tested, usually producing the strongest bounce. This, along with Friday's price action, suggests that a rally is due, anywhere from 1250-1300.
Friday, August 5, 2011
However...
(Added: Today's bias is negative. The high of the day so far was 1200+18. A symmetric 1200-18 is 1182. I am buying if we get there!)
RSI on most indexes is below 30. A break below 30 usually signifies a continuation of the current direction-- momentum overcomes reversion to the mean. Moreover, many trendlines have been pierced.
Back to momentum, treasuries are also providing a clue that there may be a bit more to go.
Another possibility is another 25-30 point rally followed by one more move lower, say, to 1175. I prefer 1175 to the 1185-1190 targets given by the analysis in the previous post. Below are three intersecting trendlines at 1175; two are basic trendlines, the third comes from an "Andrew's pitchfork".
Thursday, August 4, 2011
1185-1190
The S&P hit 1200 and the VIX crossed 30. A bottom around this area makes sense. In the event of weakness tomorrow, I will use the following analysis as a tool:

Above is a fractal comparison of the 2007 bull market top with the present period. The principle I am highlighting is that the correction bottomed at the previous low minus half the distance from the previous low to high. This is analogous to Darvas boxes. In the present sitation, 1250 to 1370 was 120 points. 1250 minus 60 points yields 1190 as a price target. What I like about 1190 is that 1200 may be serving as an uncle point for some holders of stock.

Above is the Nasdaq 100, which has been the strongest index. It needs another 1.18% drop to reach its prior low, which is a natural support area-- and may provide support for other indexes. A equivalent drop would bring SPX to 1185.
Some Targets
(Added at 9:50 AM. Today's intraday bias is negative, indicating that weakness can continue for the remainder of the trading session.)

According to Elliott Wave, a correction ends at wave-4 of its preceding sub-wave. I have drawn this structure in the image above. Wave-4 was between 1175 and 1227.
If tomorrow is ugly, that may result in a Non-Farm Payroll trend reversal day.
Whatever price when the VIX hits 30.
A 10% correction yields 1233.
1220 was the April 2010 high.
I like 1200 the most because 1) it is a round number 2)it is 50 points lower than the 1250 March low, which was roughly 100 points lower than its preceding high and 3) the 26.3% retracement, also in the image above, is at 1203 and 4) this is the midpoint of the wave-4 range.
Wednesday, August 3, 2011
S&P 500 Intraday Bias, 10:00 AM
Neutral
The market closed below the bull market trendline. I anticipate a VIX reading in the 30 area will coincide with a low.
Treasuries are behaving like an early breakout that will continue. See TLT.
The market closed below the bull market trendline. I anticipate a VIX reading in the 30 area will coincide with a low.
Treasuries are behaving like an early breakout that will continue. See TLT.
Tuesday, August 2, 2011
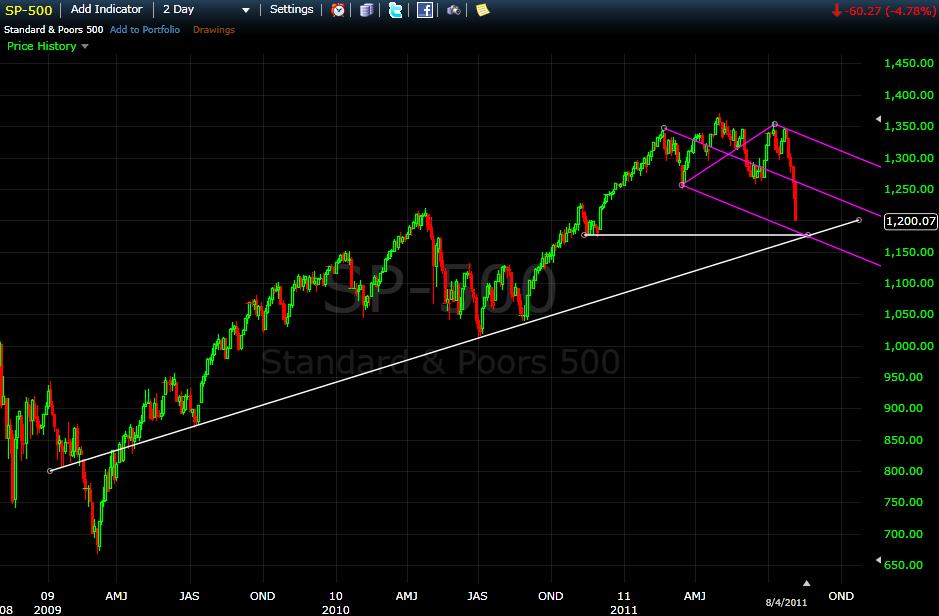
FYI

The trendline that I introduced on May 24, is very popular by now, so there is not much new in this post. I simply wanted to point out that today, that trendline was hit, coinciding with many SPX downward forecast revisions, including my own. 1250, 1258, 1271 are each higher lows. I think there is chance this trendline will hold.
Added: the Dow, which as been the strongest index, is also very close to its 200 day MA.
S&P 500 Intraday Bias, 10:00 AM
Neutral
We may not get there, but I am waiting for the VIX of 30 to buy.
We may not get there, but I am waiting for the VIX of 30 to buy.
Subscribe to:
Posts (Atom)

