At 10:01 AM, Neutral, suggesting consolidation.
UPDATE: 12:30 pm, the bias has strengthened to Positive, suggesting buy the dips intraday.
Friday, December 30, 2011
Thursday, December 29, 2011
Wednesday, December 28, 2011
Note
A longer term chart of the indicator I used for the intraday bias is showing big negative divergences with the recent strength of the stock market. I retain my forecast of a drop in prices, the next target for the S&P being 1100-1130, which acted as support many times during this volatile autumn.
Note that TLT, the ETF for the 20 year bond, has been making higher highs and higher lows and hugging its 50 day moving average. The pattern it is forming looks like an ascending triangle, which is a "continuation pattern," meaning the prior trend, up, will resume. A upside breakout may coincide with a stock market decline.

Note that TLT, the ETF for the 20 year bond, has been making higher highs and higher lows and hugging its 50 day moving average. The pattern it is forming looks like an ascending triangle, which is a "continuation pattern," meaning the prior trend, up, will resume. A upside breakout may coincide with a stock market decline.

Tuesday, December 27, 2011
Friday, December 23, 2011
Thursday, December 22, 2011
Wednesday, December 21, 2011
S&P 500 Intraday Bias, 12/21/11
At 9:36 AM, negative, suggesting sell the rallies intraday. (Subject to change a little later in the day.)
UPDATE, 12:30 PM: There has been NO change to the bias. I posted today at 9:36 AM because at the time, the bias was clearly negative and prices had not declined much yet, so I was trying to post ahead of the price move. Data between 9:30-10:00 AM can be noisy, so I included the "subject to change" warning.
UPDATE, 12:30 PM: There has been NO change to the bias. I posted today at 9:36 AM because at the time, the bias was clearly negative and prices had not declined much yet, so I was trying to post ahead of the price move. Data between 9:30-10:00 AM can be noisy, so I included the "subject to change" warning.
Tuesday, December 20, 2011
S&P Intraday Bias 12/20/11
At 9:51 AM, Positive, suggesting buy the dips intraday.
UPDATE, 2:20 PM. The bias has weakened to neutral.
Monday, December 19, 2011
Monday, December 12, 2011
Out for the week
I will not be available to post for the remainder of the week. Happy trading everyone.
S&P 500 Intraday Bias, 11/12/11
At 9:50 AM, Negative, suggesting sell the rallies intrady.
Friday was the final bull-trap rally.
Friday was the final bull-trap rally.
Saturday, December 10, 2011
Master Key, Chapters V-VIII
"Knowledge does not apply itself."
I am currently on Chapter XII, from which the above quotation comes, so one can deduce that I am a little behind on my updates.
Our imagination is the constructive form of Thinking. You can utilize a guided form of thinking to reach inner states and achievements for yourself. To do so requires powerful concentration; it cannot be done half-heartedly. When an ideal is fully formed in the mind--every detail laid out and perfected-- it can be realized. As such, we have a great power. That power must be guided by certain exact principles, or laws. Without them, the creative thinking process would be ineffective. We also must put these principles into practice; without application, without exercise, the intended creations are not possible.
The exercises of these chapters have been geared towards concentration and imagination, a sort of "training" for your ability to use your thinking to create and achieve.
I have not been as diligent at exercising these principles recently, but through reading the chapters carefully and discussing them, I am convinced that fully forming an ideal in your mind will lead to its actualization.
Friday, December 9, 2011
Thursday, December 8, 2011
S&P 500 Intraday Bias, 12/8/11
At 10:03 AM, Negative, suggesting sell the rallies intraday.
A topping pattern has been forming. This suggests the market will soon begin a swing down-- perhaps even today.
Recap of why I'm bearish.
A topping pattern has been forming. This suggests the market will soon begin a swing down-- perhaps even today.
Recap of why I'm bearish.
Wednesday, December 7, 2011
Tuesday, December 6, 2011
Trade
I just bought the UltraShort S&P, ticker (SDS) at 19.55. SPX was around 1255-1256. It's a small position because I don't have the resources to monitor it too closely.
Monday, December 5, 2011
Friday, December 2, 2011
S&P 500 Intraday Bias, 11/2/11
At 9:54 AM, Positive, suggesting by the dips intraday.
Update, 11:18 AM, the bias has weakened to Neutral.
Update, 11:18 AM, the bias has weakened to Neutral.
Thursday, December 1, 2011
Wednesday, November 30, 2011
I Don't Buy It
The price action of the last three days, which fits the "bear market rally" description, is not enough to change my thesis of a bear market. See links below.
The third phase
Analog
Commentary
The above analysis suggests this rally is another sell opportunity. I am not sure at what price, perhaps around 1250-1270, but don't hold me to that.
The third phase
Analog
Commentary
The above analysis suggests this rally is another sell opportunity. I am not sure at what price, perhaps around 1250-1270, but don't hold me to that.
S&P 500 Intraday Bias, 11/30/11
At 10:00 am, Positive, suggesting buy the dips intraday.
I would like to thank those who participated in the poll. My concern that people preferred the site without the bias has been appeased.
I would like to thank those who participated in the poll. My concern that people preferred the site without the bias has been appeased.
Tuesday, November 29, 2011
Thursday, November 24, 2011
Grateful for You
This is a small site. Having a readership that I feel enjoys the site and perhaps benefits from it helps me stay committed to it. So, thank you.
Wednesday, November 23, 2011
Tuesday, November 22, 2011
Friday, November 18, 2011
Thursday, November 17, 2011
Monday, November 14, 2011
Thursday, November 10, 2011
S&P 500 Intraday Bias, 11/10/11
At 12:11 PM, the bias has strengthened to neutral, suggesting consolidation.
At 10:03 AM, Negative, suggesting sell the rallies intraday.
At 10:03 AM, Negative, suggesting sell the rallies intraday.
Wednesday, November 9, 2011
Bias and Commentary
This Saturday, I wrote "One can expect prices to continue forming a top around the 200 day moving average before the next leg down." Yesterday, prices once again hit the 200 day and now the S&P opened down 30 points. This choppy trading is a topping formation. If this thesis is correct--and evidence is mounting--the 1290 area will be the next "lower high" in a bear market, and a break below 1070 is the next significant move.
Today's bias at 9:45 AM, is negative, suggesting sell the rallies intraday.
Today's bias at 9:45 AM, is negative, suggesting sell the rallies intraday.
Tuesday, November 8, 2011
Monday, November 7, 2011
S&P 500 Intraday Bias, 11/07/11
At 10:00 AM, Neutral, suggesting consolidation.
*Correction at 10:06 AM -- the bias is Negative, suggesting sell the rallies intraday.
*Correction at 10:06 AM -- the bias is Negative, suggesting sell the rallies intraday.
Saturday, November 5, 2011
Distribution - First Leg - Recovery - Second Leg

The image above compares the earlier stages of the 2007-2009 bear market with the present. The 200 day MA is plotted on both charts. Based on the analog, one can expect prices to continue forming a top around the 200 day moving average before the next leg down.
Friday, November 4, 2011
Thursday, November 3, 2011
Wednesday, November 2, 2011
S&P 500 Intraday Bias, 11/2/11
At 10:10 AM positive, suggesting buy the dips intraday. However, a gap up during a downtrend is usually faded, and today is the FOMC announcement, so I would disregard today's bias.
Tuesday, November 1, 2011
Sunday, October 30, 2011
"Then the third phase begins..."
Evidence suggests that stocks are in a bear market.

The upper chart is the ratio of the equally weighted S&P 500 to the popular, market cap weighted S&P 500. This ratio is a measure of internal market strength. Note that a big divergence between the actual S&P, the lower chart, and the ratio has formed.
The green box noted "major topping formation" is synonymous with "distribution" in following quotation from Edwards and Magee's Technical Analysis of Stock Trends. It describes this year very well.
"Primary Downtrends are also usually (but again, not invariably) characterized by three phases. The first is the distribution period (which really starts in the later stages of the preceding Bull Market). During this phase, farsighted investors sense the fact that business earnings have reached an abnormal height and unload their holdings at an increasing pace. Trading volume is still high, though tending to diminish on rallies, and the “public” is still active but beginning to show signs of frustration as hoped-for profits fade away.
The second phase is the Panic Phase. Buyers begin to thin out and sellers become more urgent; the downward trend of prices suddenly accelerates into an almost vertical drop, while volume mounts to climactic proportions. After the Panic Phase (which usually runs too far relative to then-existing business conditions), there may be a fairly long Secondary Recovery or a sideways movement, and then the third phase begins."
The third phase is another down leg.
Friday, October 28, 2011
Thursday, October 27, 2011
Resistance
spx is at its 200 day moving average, which should act as resistance. I believe that it is a good time to begin selling.
this post was written from my android phone. I currently don't have a internet connection
Monday, October 24, 2011
Tuesday, October 18, 2011
Monday, October 17, 2011
S&P 500 Intraday Bias, 10/17/2011
At 10:05, negative, suggesting sell the rallies intraday.
I believe we are at, or close to, a b wave decline.
I believe we are at, or close to, a b wave decline.
Friday, October 14, 2011
Thursday, October 13, 2011
Tuesday, October 11, 2011
Friday, October 7, 2011
Scheduling Conflicts
I know that this coming Monday and Wednesday, I will also not be around to post the intraday bias. This uncertain availability is a developing trend. I'm deliberating whether I should post the bias sporadically, or discontinue it, and just keep doing the occasional analytically posts if I've perceived something that may be useful.
S&P 500 Intraday Bias, 10:00 AM
No clear signal now. And I will not be able to monitor after 11:30 AM.
Thursday, October 6, 2011
Intraday Bias 11:06 AM
I apologize for the whipsaw, but the bias has turned positive, suggesting by the dips intraday.
Tuesday, October 4, 2011
Seems like a bullish trend reversal day
Also...

If the above wave count is correct, a 3-wave counter trend rally is in the horizon.

If the above wave count is correct, a 3-wave counter trend rally is in the horizon.
Friday, September 30, 2011
Thursday, September 29, 2011
S&P 500 Intraday Bias, 10:00 AM
Positive, suggesting buy the dips intraday.
Interestingly, prices are trading more frequently in the 1150-1190 range, as predicted by market profile here.
Interestingly, prices are trading more frequently in the 1150-1190 range, as predicted by market profile here.
Wednesday, September 28, 2011
Tuesday, September 27, 2011
Monday, September 26, 2011
Have bond prices peaked?
If so, just as in last summer, they peaked on the expected Fed news of treasury purchasing programs.
Friday, September 23, 2011
Market Profile Says: Expect More Trading Between 1150-1190
Today, I asked myself, "Will the market spend more time trading between 1100 and 1230, or is it about to break out?" A technical method that aids in answering this question is a "Market Profile" chart. (One day, this method will probably be as run-of-the-mill as others.) In such charts, the y-axis is price and the x-axis is the frequency of how many times the market traded at that price for a given time interval, just as a bar chart can be from 1-min to quarterly, over a given period.
According to market profile, when prices are range bound, they usually spend the most time, i.e. have the highest frequency, around the center of the range, forming a sideways bell curve. It is not until this bell curve is complete that prices begin to break out to a new trading range. These charts are also fractal in nature, with smaller bell curves making up a portion of a greater curve.
I constructed a market profile chart of the last couple of months based on the range of prices for 30 minute time intervals. (There are software vendors for market profile, but I created this study on excel.) During this time period, prices have swayed between 1100 and 1230 several times. As you can see in the chart below, two minor bell curves have formed that are part of larger distribution in which the center area, which should have the highest frequency, has yet to fill. The conclusion from this chart is, more trading should occur between 1150-1190, the unfilled center of the distribution.

Now, a conclusion from one technical study is far, far from definitive. The reason I post this is to offer a perspective not as easily encounterable elsewhere on this financial blogosphere, especially now when a break below 1100 seems imminent.
Thursday, September 22, 2011
S&P 500 Intraday Bias, 10:03 AM
Negative, suggesting sell the rallies intraday.
(It is possible for the bias to be positive in a day like today.)
(It is possible for the bias to be positive in a day like today.)
Wednesday, September 21, 2011
The Fat Lady

The chart posted is of the semiconductor index. It is inches from a textbook support area, that is, the previous highs that prices broke above. I believe whether it breaks or not will be serve as confirmation of what's to come.
Tuesday, September 20, 2011
Monday, September 19, 2011
Saturday, September 17, 2011
Master Key, Chapters I - IV
The principles thus far covered in the book are: states of being and circumstances, in some cases, come from within; the subconscious is a creative, powerful force that the conscious can control by directing it towards specific goals or desires; by that means, and by cultivating one's "within" anything can be attained as if by a birthright, a boundless power all people possess; discordant emotions, fear, anger, sadness, worry, should and can be eliminated from the self; there is a true self that can be what you will be.
The exercises have built upon each other, week by week; sit still, inhibit all thoughts, let go physically (relax), let go emotionally.
One unique, valuable thing about this book is that it focuses on being able to apply the principles it teaches.
Through the readings and exercises, I have definitely come to be more empowered. I have benefited most in applying the principle of directing the subconscious towards specific goals. In my case, conceiving creation solutions to issues. A small group has formed, for which I am grateful, and in which we share our experiences with a chapter and its exercise on a weekly basis.
Friday, September 16, 2011
S&P Intraday Bias, 10:00 AM
(Very) positive, suggesting buy the dips intraday, and a strong trading session.
Thursday, September 15, 2011
Wednesday, September 14, 2011
Tuesday, September 13, 2011
S&P 500 Intraday Bias, 9:55 AM
Positive, in this context, suggesting the market will be strong today.
Monday, September 12, 2011
Semi Bullish

The semiconductor index was in positive territory the entire trading day, and closed up over 3%. The horizontal line in the chart is a bullish breakout level.

This chart is the ratio of the semiconductor index to consumer staples, a contrast of a hyper-sensitive, cyclical industry, with a defensive sector. A break above the trendline, and a first higher-low, higher-high in a long time may occur soon.

Above are the relative strength lines of consumer discretionary, technology, and transports, respectively, against the S&P 500. According to John Murphy's work on sector rotation, in that order, those sectors show relative strength as the economy moves from a late contraction to early expansion phase. The charts are following that script, suggesting we will see an uptick in the economy.
I am inclined to conclude that the next significant development is for the S&P 500 to reach its 200 day moving average, currently at 1283. Treasuries and Gold should correct.
Sunday, September 11, 2011
Elliott Wave for Thought

Above are three identical charts, each showing a different Elliot Wave interpretation, "count."
The first count is impossible because, according to the rigid rules of Elliott Wave, wave-4 cannot overlap wave-1. The count is deceptive because for anyone bullish, the corrective waves 2 and 4 are pretty similar in nature.
Given that the first chart can be ruled out, we are left with two possibilities. The most likely is chart two, in which the bull market from 2009 to 2011 was a counter trend, a-b-c, that is part of a larger bear market than began in 2007.
The only valid count that is bullish is the third chart, in which this current correction, not being a wave-4, can overlap wave-1. This is possible by classifying this correction as sub-wave-ii of wave-3 (of a five wave advance.)
I don't necessarily believe in Elliott Wave, but this post is my best assessment--which I am very confidence is accurate--of the market according to the theory's principles.
Friday, September 9, 2011
S&P 500 Intraday Bias, 10:00 AM
Neutral, suggesting, in this context, that selling will be contained by the morning's low.
Thursday, September 8, 2011
Wednesday, September 7, 2011
Friday, September 2, 2011
Is ES 1175 a buy?

Things happen so quickly in this market. The drop from 1230 to 1175 over a two day span is a drop equivalent to the previous drop from 1190 to 1135. Moreover, 1175, hit today, fills a gap exactly. I have neither the courage, nor the preparation to buy, but I feel that this is worth pointing out. If a base forms around 1175 (on ES), that would build courage.
S&P 500 Intraday Bias, 10:00 AM
Negative, suggesting weakness will continue for the remainder of the trading session.
Thursday, September 1, 2011
Update
Added: prices shot upward with the positive surprise from 10 AM's economic news. If the market gives up these gains today, I will presume that a new swing downward is beginning. If strength continues, I reaffirm my 1250-1260 target.
S&P 500 Intraday Bias, 10:00 AM
Negative, suggesting weakness will continue for the remainder of the day. I disagree, and believe today will close up.
Wednesday, August 31, 2011
Tuesday, August 30, 2011
In the Cards

Now that SPX has met my objective of surpassing 1208, which I wrote when it was in the 1130s, here, I see a move to 1250-1260, followed by a drop to 1200, then a move to 1295ish. The circles are the points of contact along the resistance levels.
To me, this is possible because a) short squeeze territory is above 1250 b)the 200 day MA or EMA can be around 1280-1300 if and when prices reach there and c)a retracement that large before another drop conforms to the market's habit of being deceptive.
Thursday, August 25, 2011
S&P 500 Intraday Bias, 10:45 AM
Negative, suggesting the market will remain weak today. However, I think this sell off it a reaction that is part of an upswing.
Wednesday, August 24, 2011
Tuesday, August 23, 2011
Comment
The S&P seems to be forming a double bottom and may soon begin a move above 1208, perhaps today.
Monday, August 22, 2011
Saturday, August 20, 2011
In case you missed it...
Here an in article by Will Rahal on the economy, published when the S&P 500 was at 1345: The Economy: a Structural Problem.
Friday, August 19, 2011
Thursday, August 18, 2011
S&P 500 Intraday Bias, 10:05 AM
Negative, which, in today's context, indicates no positive divergence.
Wednesday, August 17, 2011
Tuesday, August 16, 2011
Monday, August 15, 2011
Sold BGU at 58.10
At 3:27PM, when SPX was at about 1200. (I originally bought in the low 1180s.)
I sold in order to play it safe, but I think 1250 is in the cards before another downturn in prices.
I sold in order to play it safe, but I think 1250 is in the cards before another downturn in prices.
S&P 500 Intraday Bias, 9:55 AM
Positive, suggesting strength will continue for the remainder of the trading session.
Friday, August 12, 2011
Wednesday, August 10, 2011
S&P 500 Intraday Bias, 10:00 AM
Neutral, no clear signal as of yet for market direction for the remainder of the trading day.
Tuesday, August 9, 2011
Failed T

The image is a follow up to the T I first presented on July 9, here. Within the first day or two of that post, I added "If this T fails, a valid interpretation is that we are in a bear market."
It's expiring right around now, so there's another nail in the coffin-- not that "were're in a bear market" isn't a widespread conclusion already.
Added: since it seems like the market bottomed short term while this T expired, would this constitute a inverse T? Looks like it, but I am not sure I completely buy into whether they exist. Just wanted to point it out.
S&P 500 Intraday Bias, 9:45 AM
Positive, suggesting buy the dips intraday. I published this early given the dip at the open.
Monday, August 8, 2011
S&P 500 Intraday Bias, 10:15 AM
The bias remains negative, implying that the market will remain weak the remainder of the day.
Nevertheless, I think there may be a bounce today.
Nevertheless, I think there may be a bounce today.
Saturday, August 6, 2011
Correction Target

Above is the NYSE advance-decline line with its 200 day moving average. On Friday, the moving average was penetrated although the line closed slightly above it. This is the first time in the bull market that the 200 day MA was tested, usually producing the strongest bounce. This, along with Friday's price action, suggests that a rally is due, anywhere from 1250-1300.
Friday, August 5, 2011
However...
(Added: Today's bias is negative. The high of the day so far was 1200+18. A symmetric 1200-18 is 1182. I am buying if we get there!)
RSI on most indexes is below 30. A break below 30 usually signifies a continuation of the current direction-- momentum overcomes reversion to the mean. Moreover, many trendlines have been pierced.
Back to momentum, treasuries are also providing a clue that there may be a bit more to go.
Another possibility is another 25-30 point rally followed by one more move lower, say, to 1175. I prefer 1175 to the 1185-1190 targets given by the analysis in the previous post. Below are three intersecting trendlines at 1175; two are basic trendlines, the third comes from an "Andrew's pitchfork".
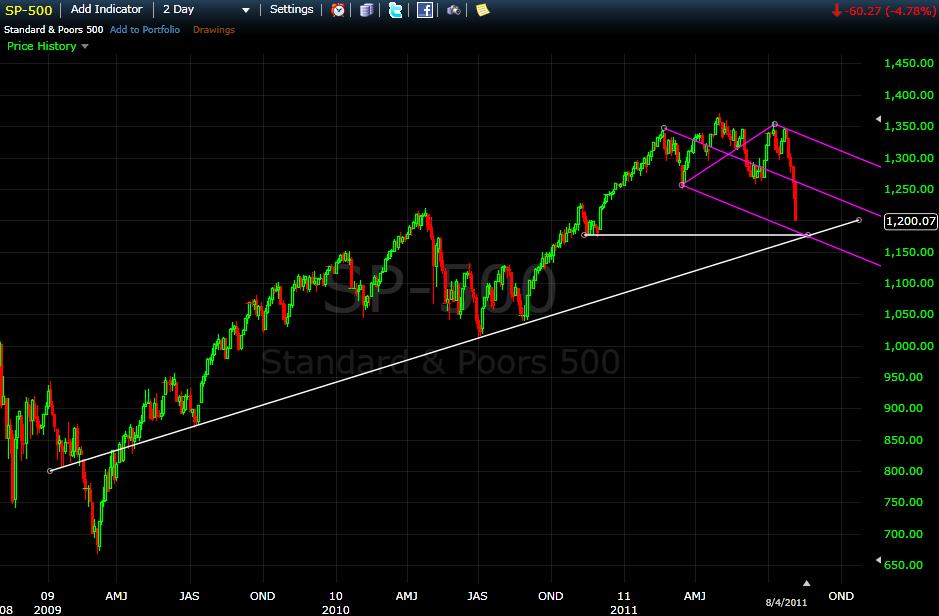
Thursday, August 4, 2011
1185-1190
The S&P hit 1200 and the VIX crossed 30. A bottom around this area makes sense. In the event of weakness tomorrow, I will use the following analysis as a tool:

Above is a fractal comparison of the 2007 bull market top with the present period. The principle I am highlighting is that the correction bottomed at the previous low minus half the distance from the previous low to high. This is analogous to Darvas boxes. In the present sitation, 1250 to 1370 was 120 points. 1250 minus 60 points yields 1190 as a price target. What I like about 1190 is that 1200 may be serving as an uncle point for some holders of stock.

Above is the Nasdaq 100, which has been the strongest index. It needs another 1.18% drop to reach its prior low, which is a natural support area-- and may provide support for other indexes. A equivalent drop would bring SPX to 1185.
Some Targets
(Added at 9:50 AM. Today's intraday bias is negative, indicating that weakness can continue for the remainder of the trading session.)

According to Elliott Wave, a correction ends at wave-4 of its preceding sub-wave. I have drawn this structure in the image above. Wave-4 was between 1175 and 1227.
If tomorrow is ugly, that may result in a Non-Farm Payroll trend reversal day.
Whatever price when the VIX hits 30.
A 10% correction yields 1233.
1220 was the April 2010 high.
I like 1200 the most because 1) it is a round number 2)it is 50 points lower than the 1250 March low, which was roughly 100 points lower than its preceding high and 3) the 26.3% retracement, also in the image above, is at 1203 and 4) this is the midpoint of the wave-4 range.
Wednesday, August 3, 2011
S&P 500 Intraday Bias, 10:00 AM
Neutral
The market closed below the bull market trendline. I anticipate a VIX reading in the 30 area will coincide with a low.
Treasuries are behaving like an early breakout that will continue. See TLT.
The market closed below the bull market trendline. I anticipate a VIX reading in the 30 area will coincide with a low.
Treasuries are behaving like an early breakout that will continue. See TLT.
Tuesday, August 2, 2011
FYI

The trendline that I introduced on May 24, is very popular by now, so there is not much new in this post. I simply wanted to point out that today, that trendline was hit, coinciding with many SPX downward forecast revisions, including my own. 1250, 1258, 1271 are each higher lows. I think there is chance this trendline will hold.
Added: the Dow, which as been the strongest index, is also very close to its 200 day MA.
S&P 500 Intraday Bias, 10:00 AM
Neutral
We may not get there, but I am waiting for the VIX of 30 to buy.
We may not get there, but I am waiting for the VIX of 30 to buy.
Sunday, July 31, 2011
Friday, July 29, 2011
Thursday, July 28, 2011
Wednesday, July 27, 2011
S&P 500 Intraday Bias, 10:00 AM
Negative and the oversold condition has been relieved.
(Forgot to hit publish! Post written at 10AM, published at 10:22AM)
(Forgot to hit publish! Post written at 10AM, published at 10:22AM)
Tuesday, July 26, 2011
Monday, July 25, 2011
Saturday, July 23, 2011
The Economy: A Structural Problem by Will Rahal
For several decades, the consumer, business and government sectors embarked on a journey of increasing debt dependence for consumption and political popularity. This led to unsustainable credit expansion, which ultimately resulted in a financial crisis.
History has shown that many years are needed to unwind the excesses while the economy balances on a tight rope high above ground and financial authorities struggle to provide a safety net below.

The chart above shows the three-year growth rate of nominal GDP over a sixty-year period. The chart clearly illustrates how unusually slow the economy has grown recently; it is currently at one-third the average of the period. The economy has a structural problem.
Nevertheless, there will be some periods of strength as the chart below indicates.

Plotted is the difference between the year-and-a-half annualized growth rate and a three-year annualized growth rate of nominal GDP. Note that it is about to roll over, suggesting a significant deceleration.
So where is the safety net? Bernanke understands the structural problem and has thus engaged in monetary easing. Judging from the deceleration that is coming, however, one can conclude that the timing of QE2 could have been better. Since a third round of quantitative easing is harder to sell than a second round, there may be a tardy response to the economic slowdown.
What about the markets?
Earnings, which are increasingly dependent on a global economy, have done well. The world, however, is plagued with the same malaise as the US. Expect a slowdown.
The injection of liquidity from monetary easing benefits the markets. Commodities compete with financial markets, and have the effect of P/E contraction, which partially explains why, in spite of record earnings, many indexes are still below their lifetime highs.
In summary, sub-par economic performance will continue and it better be viewed as a structural problem that is well understood by financial authorities. This understanding will not guarantee a smooth ride, but will provide a cushion.
Friday, July 22, 2011
Thursday, July 21, 2011
Wednesday, July 20, 2011
Tuesday, July 19, 2011
The Master Key System
One month ago, I asked for book recommendations of the self-help genre. To my great benefit, many people offered a suggestion. I plan to read each suggestion, provided that my judgement approves. Currently, I am reading The 7 Habits of Highly Effective People and have begun The Master Key System (along with other books of my own choosing.)
The latter, published in 1912, and rumored to be what inspired Bill Gates to start Microsoft, prescribes that it be read over a 24 week period, a week given to each chapter. Initially, having read the Foreword and Introduction, the book seemed to be comprised of self-absorbed metaphysical musings, which, when done systematically, resemble all too many philosophical works. To my delight, however, I discovered that each chapter ends with an exercise that is essentially meditation-- and the author calls this the application of the principles.
A search for the keywords "Zen, Buddhism" on Amazon.com yields 2,422 paperback book results. Read a 5 page description of meditation exercises, then meditate every day, and you will never have to read a single word from any of those 2,422 books to expertly know what Zen is.
A common criticisms of self-help books is that they invoke only a transient inspiration, and none of the principles are habitualized. I agree. Through meditation, however, one can truly implement wise suggestions. By promoting meditation, long before it was popularized in the United States, the author and the potential utility of his book's "teachings", have gained credibility in my eyes.
To help ensure that I stick with the 24 week course, I have decided to post my journey through The Master Key System on this blog. Should be fun.
Monday, July 18, 2011
Next Stop, 1280-1285

Above is a 30-minute, candlestick chart of SPX. There are three Darvas boxes of approximately equal length stacked upon eachother. Prices have yet to reach the bottom of the third box, which will be around 1280-1285, hence, the price target.
S&P 500 Intraday Bias 10:00 AM
Negative
With SPX down as much as it is, that is not much help. I will not be available later today, so I will post an update before I leave. It is only worth pointing out that there are no positive divergences based on this indicator.
With SPX down as much as it is, that is not much help. I will not be available later today, so I will post an update before I leave. It is only worth pointing out that there are no positive divergences based on this indicator.
Friday, July 15, 2011
Thursday, July 14, 2011
S&P 500 Intraday Bias, 10:00 AM
Positive
It seems like a base has formed since Monday and that the sell-off that began from 1356 is over. If today is a high-range day in which prices continually grind up, and that closes near the high of the day, that would add confirmation to this assessment.
It seems like a base has formed since Monday and that the sell-off that began from 1356 is over. If today is a high-range day in which prices continually grind up, and that closes near the high of the day, that would add confirmation to this assessment.
Wednesday, July 13, 2011
Monday, July 11, 2011
Saturday, July 9, 2011

Friday, July 8, 2011
Intraday Bias 10:00 AM
Negative
I am not sure how reliable the bias is today due to complex factors relating to the dominant trend, current price action and the payroll report. However, the bias has been positive on days with big down gaps, so there is no bullish divergence.
I am not sure how reliable the bias is today due to complex factors relating to the dominant trend, current price action and the payroll report. However, the bias has been positive on days with big down gaps, so there is no bullish divergence.
Thursday, July 7, 2011
Intraday Bias 10:00 AM
Positive
If this is indeed the start of another leg up, I don't think the market will let any of the "buy the dips" traders in for a while. This is the norm for a new up-leg. Contrawise, a pull back would be more bearish than it originally would appear to be.
If this is indeed the start of another leg up, I don't think the market will let any of the "buy the dips" traders in for a while. This is the norm for a new up-leg. Contrawise, a pull back would be more bearish than it originally would appear to be.
Wednesday, July 6, 2011
Friday, July 1, 2011

Thursday, June 30, 2011
S&P 500 Intraday Bias, 10:00 AM
The bias is positive, but my analysis suggests that SPX has reached resistance and will encounter some selling pressure.
Wednesday, June 29, 2011
Sold SSO at 51.82
5.4% loss. I bought SSO several weeks ago, when the S&P 500 was approximately at 1343. This was truly a terrible, amateur trade on several fronts. It also made me glad I don't trade options.
I have sold at around 1307 on SPX. The high today of 1309 is close enough to 1312, which I believe may act as resistance. This post explains why.
I have sold at around 1307 on SPX. The high today of 1309 is close enough to 1312, which I believe may act as resistance. This post explains why.
Tuesday, June 28, 2011
SPX Resistance at 1315

Above is a daily candlestick chart of the S&P 500. It has three technical studies. One is a downward sloping trendline. Another is a horizontal line at 1312, which was previously support-- now resistance. The 50 day moving average, which is also resistance, since prices are below it, is at 1316. The midpoint of the drop from 1370 to 1258 is 1314.
This confluence of forces around 1315 suggests that it may serve as a first level of resistance.
S&P 500 Intraday Bias, 9:55 AM
Positive
(I am publishing before the 10 AM consumer confidence report to distinguish the indicator from whatever the news results may be.)
(I am publishing before the 10 AM consumer confidence report to distinguish the indicator from whatever the news results may be.)
Monday, June 27, 2011
Thursday, June 23, 2011
Wednesday, June 22, 2011
Tuesday, June 21, 2011
Friday, June 17, 2011
Please, Recommend a Book
If anyone has a 5-star book of the self-help genre to recommend to me, please do so. I am always eager to learn and improve. For example, I would highly recommend Dale Carnegie's, How to Win Friends and Influence People. For those who haven't read it, the book suggests people skills that enhance and bring harmony to relationships.
My philosophy is that there are too many exceptional books in the world to give time to reading really good books. So, please recommend only the best!
Recommendations so Far (Many given anonymously)
"As a Man Thinketh" by James Allen - recommended by spf5
"The Master Key System" by Charles Haanel
"The Children of the Law of One & the Lost Teachings of Atlantis" by John Peniel
"7 Habits of Highly Effective People" by Stephen Covey - recommended by Narayana
"The Purpose Driven Life" by Rick Warren
Books on the power of the subconscious by James K. Van Fleet
"Extraordinary Popular Delusions and the Madness of Crowds" by Charles Mackay - recommended by Jessie Livermore via Anon
"Hagakure: The Book of the Samurai" - recommended by Anon
"How to Win Friends & Influence People" by Dale Carnegie - recommended by George R.
"The Little Prince" by Antoine de Saint-Exupéry - recommended by George R.
"Getting to Yes: Negotiating Agreement Without Giving In" by Roger Fisher et al. - recommended by M.T.
"The Logic Of Failure: Recognizing And Avoiding Error In Complex Situations" by Dietrich Dörner - recommended by M.T.
"Worldwide Laws Of Life: 200 Eternal Spiritual Principles" By Sir John Templeton - recommended by JC
"Reframing Change: How to Deal with Workplace Dynamics, Influence Others, and Bring People Together to Initiate Positive Change" Written by and recommended by Jean Latting
Thursday, June 16, 2011
HPQ
I've read that relative strength persists and relative weakness persists. I am presenting here a stock of relative weakness. I have very little experience with individual stocks; I am presenting the parallel channel below because it does intrigue me. I welcome any thoughts on the matter.


Wednesday, June 15, 2011
Two S&P Parallel Channels
I will not be able to post and monitor the intraday bias today. Here are two potentially useful channels.


Tuesday, June 14, 2011
Reaction to News
There are always expectations set on the results of a specific news event, whether economic or company specific, i.e., earnings. For the stock market, there is no such thing as good or bad news. There are three categories, actually. News can either meet, exceed, or fall short of expectations. The market can initially not react, react accordingly, under-react, or over-react. That initial reaction can reverse or continue. My permutation and combination knowledge is rusty, so correct me if I am wrong, but that makes for 24 combinations.(?)
Each of those 24 possibilities carries its own interpretative significance-- or insignificance. This is why it is vital even for a technical analyst to be very aware of the news.
Last week, I wrote that "I believe the market will react very strongly to any news that beats expectations and may even react strongly to in-line news, given the recent string of disappointments."

Above is a 5-minute bar chart of one day of after-hours trading on the September S&P futures contract. The most recent strong green bar with very high volume was a reaction to the scheduled retail sales economic news release. These were the results, courtesy of Econoday and Bloomberg:

One may consider today's news a beat because of the upward revisions to last month's figures, but more than anything, this is in-line news. However, the market reacted strongly, shooting up 5 points after already being up 9 points in after-hours. This is one piece of the puzzle. The final piece is whether sellers use this opportunity of higher prices to sell, reversing the reaction, or if buyers, including short-covering, dominate, continuing the reaction.
Monday, June 13, 2011
Friday, June 10, 2011
Value Investing
This blog almost entirely focuses on short term technical analysis. To provide a change of pace and a real treat, for the weekend I present a lecture by Whitney Tilson, a value-based hedge fund manager. The lecture beings during the second minute, and the first 55 minutes comprise the introduction to the principles and strategies behind value investing that I would like to share.
To quote a friend of mine, who is a value investor, but worked as a prop trader,"[Technical] ideas typically lack scalability, tax advantages, and require high commission or leverage costs. Compounding using the value approach is extremely scalable (e.g. Berkshire Hathaway), has tax advantages due to long-term capital gains rates, and requires much lower total commission costs."
Enjoy.
S&P 500 Intraday Bias, 10:00 AM
Neutral
My conviction has increased that prices are headed towards the lower bound of the parallel channel shown in a previous post, currently, at 1250.
My conviction has increased that prices are headed towards the lower bound of the parallel channel shown in a previous post, currently, at 1250.
Thursday, June 9, 2011
Wednesday, June 8, 2011
S&P Technical Picture
Below is one possible interpretation of the current market's technical picture.

The study above includes a downward sloping parallel channel, the 220 day exponential moving average (my default one), and RSI-14 below. Note that the 220 EMA and the channel intersect at around 1250. Also notice that RSI is close to 30, an oversold level at which one can expect a bounce. My guess is that SPX will reach 30 on RSI sooner or later.

The study above includes a downward sloping parallel channel, the 220 day exponential moving average (my default one), and RSI-14 below. Note that the 220 EMA and the channel intersect at around 1250. Also notice that RSI is close to 30, an oversold level at which one can expect a bounce. My guess is that SPX will reach 30 on RSI sooner or later.
Monday, June 6, 2011
Touching Base
It is evident that my call for a bottom around 1300 and for the major trendline to hold (on the log scale) has been proved wrong. I don't have anything to add that isn't being said somewhere else.
My only two cents are that I believe the market will react very strongly to any news that beats expectations and may even react strongly to in-line news, given the recent string of disappointments. Note, Ben Bernanke speaks tomorrow at 3:45 PM.
My third cent: the market has been trading in a range since February. When markets are range bound, the technical relationship between moving averages and prices become muddled. As such, I wouldn't give much weight to prices "breaking" above or below shorter term moving averages. My guess is that only a move to a 200 day moving average would provide a valid technical signal.
Edit - June 7, 2011
When I wrote, "My guess is that only a move to a 200 day moving average would provide a valid technical signal," that would implicitly be a buy signal. Just making it explicit.
Financials Trendline

The chart above is a 6-month, daily candlestick chart of a financial sector ETF, ticker: XLF. Financials currently have the second largest weighing in the S&P 500, at 15.15%. There are 10 sectors in the S&P. The trendline in the chart above suggests that XLF is due for a bounce to at least the upper bound of the channel. This should give the general stock market some lift.
Friday, June 3, 2011
S&P 500 Bull Market Trendline

I iterate my prior conclusion that the correction ends today; however, I would like to see a close above this trendline.
Thursday, June 2, 2011
Wednesday, June 1, 2011
A-B-C Correction Near Complete
Regarding the fist image below, I explained why such a pattern would occur in this previous post. (Also regarding the previous post, the major trendline on the log scale is at around 1300 right now.)

At this stage, it is evident that the projection drawn in yellow is playing out. Now, a parallel channel encapsulating the entire correction can be drawn, and a target area estimated with more accuracy:

By tomorrow or Friday, I project that the correction that began in May at 1370 will end around 1300. Based on a T, a rally of at least one month should follow-- hypothetically speaking, possibly an excellent buying opportunity. By the way, the end of QE2 probably has already been discounted by the market.
Intraday Bias 10:15 AM
Positive
Seems like the selling pressure may be close to being exhausted; note high volume drops on the string of disappointing economic data over the last several days.
Seems like the selling pressure may be close to being exhausted; note high volume drops on the string of disappointing economic data over the last several days.
Tuesday, May 31, 2011
Friday, May 27, 2011
Thursday, May 26, 2011
Wednesday, May 25, 2011
Tuesday, May 24, 2011
S&P 500 2011 Elliott Wave Projection
Please study the principles of the table below for a minute. [For all images, click to enlarge.]

The present market structure reflects the principle stated in box 4 of the table above. (In the past, I showed this exact table and applied the analysis to the S&P 500, which did subsequently follow the a-b-c structure.) The correction that began from the 1370s on the S&P may be completing its a-wave soon. The image below projects two possible b-c waves. In one projection, the previous high will be reached, followed by a retest of the a-wave low; in the other projecting, the b-wave rally will terminate at a lower high and the market will subsequently make a lower low.

These projections are in line with the analysis of a range bound market that I did in late April. A chart from the post is reproduced below:

Finally, the S&P may have to touch the major trendline shown in the chart below before this corrective period will be resolved to the upside. One issue is that based on whether the chart is in log or arithmetic scale, the positioning of the major trendline relative to price and time alters significantly.

Monday, May 23, 2011
Saturday, May 21, 2011
Relative Strength In the Media & Blogosphere
Since around February, defensive sectors such as consumer staples, utilities, and healthcare have outperformed the broader market. This outperformance has been used as an argument that a bull market top may be forming. This thesis is being popularly disseminated; I have seen it mentioned by analysts and even in comments sections of blogs. These defensives also outperformed in the Summer of 2010, and often do during corrections.
This attention to a non-mainstream concept reminds me of 2009, when the Russell 2000 was greatly under performing the S&P 500 from late September to November. Similarly, this fact was popularly disseminated for its bearish implications and "sector rotation" became a buzz word. The relative underperformance was also projected to continue. From December 2009 to April 2010, the Russell appreciated over 25% while the S&P 500 rose about 10%.
Trends in relative strength (RS) are perpetually in the market. Like any other trend, when they gain popular attention, these trends are probably near complete. Also, in both cases from the last three years, RS was used to support bearish forecasts. The wall of worry remains.-- Breadth also remains strong, and the Fed accommodative.
As such, I would conclude that the market is currently in a corrective phase that will ultimately be resolved to the upside.
Friday, May 20, 2011
S&P Intraday Update
I think the low of the day may be in. The euro and stock markets have sold off in anticipation of the downgrade of Greece's debt. Sell the rumor, buy the news.
Thursday, May 19, 2011
Wednesday, May 18, 2011
Tuesday, May 17, 2011
Monday, May 16, 2011
Sunday, May 15, 2011
Copper Intermediate Term Prediction

Above is an arithmetic, weekly chart of copper. A basic Elliott Wave count suggests that copper is in a correction that will precede another leg up. Since copper is a sort of leading economic indicator, I infer from this projection that the stock market will also continue to rise.
Friday Recap
Because blogger's posting dashboard was down, I could not post this information in real time.
Friday's S&P 500 intraday bias was neutral
I bought SSO (2x S&P) at 10:09 AM at 54.78
Friday's S&P 500 intraday bias was neutral
I bought SSO (2x S&P) at 10:09 AM at 54.78
Friday, May 13, 2011
Temporary Post
Blogger.com's dashboard was down today and part of last night. Since it's Friday and the market is closed already, I will bring the site up to date later this weekend.
Thursday, May 12, 2011
Wednesday, May 11, 2011
T Theorem Experiment Results
Below are two charts. They are a "before and after" of a short term T analysis that I presented earlier in this blog and of its follow-up. Link.
The prediction called for 1) a 3 day T and 2) a peak in MFI at the midpoint of this 3 day span. Both came true. (In a post following my original analysis, I erroneously anticipated that there would be no peak in MFI at the midpoint.) This validates the theorem that the right arm of a T will/should? have a peak in MFI at its midpoint. The practical application of this theorem is that it can be used to verify a T construction.

Some quick notes: MFI shown in the follow up chart has parts of its graph removed. This was to make viewing clearer because the MFI before the right arm of the T is irrelevant and the MFI after the midpoint would not be known in real time. One odd thing is that later on in the T, there were two new peaks in MFI. I circled those in pink. I am not certain of their significance, if any.
These T Theory™ based posts are dedicated to John C. for his encouragement of my development of shorter term T analysis and forecasts.
S&P 500 Intraday Bias, 10:00 AM
Positive but Overbought
As such, as I interpret it as neutral to negative. (For what it's worth, yesterday's, which was not published, was positive, lending to the overbought.)
As such, as I interpret it as neutral to negative. (For what it's worth, yesterday's, which was not published, was positive, lending to the overbought.)
Tuesday, May 10, 2011
post
won't be available this morning to post intraday bias
I "invalidated" the T too soon. The midpoint was 12:45 AM. By 11:30 AM, MFI was near a low, so I assumed an hour was not enough for MFI to make a new high. Within an hour, the market staged a powerful, unusually high volume rally that brought MFI to a new high! Boy did I feel foolish. I'll show a chart and explanation later.
I "invalidated" the T too soon. The midpoint was 12:45 AM. By 11:30 AM, MFI was near a low, so I assumed an hour was not enough for MFI to make a new high. Within an hour, the market staged a powerful, unusually high volume rally that brought MFI to a new high! Boy did I feel foolish. I'll show a chart and explanation later.
Monday, May 9, 2011
3 Day T Invalidated
For the T presented in Friday's post to be valid, a peak in MFI should have occurred at its midpoint. We are in the vicinity of the midpoint and MFI is far from being near a peak. Also, the downward sloping OBV line was never broken to the upside. From this, I conclude that the S&P 500 is in the structure shown below. (The rally stopped at the .618 retracement.)


Saturday, May 7, 2011
S&P 500 P&F Price Target - 1640

The Point & Figure "count" above is so obvious that I am sure I may have been the last person to have done this analysis, but I also presume that a price target as audacious as 1640 has inhibited its wide publication.
Doing a count and price target on a P&F chart is relatively simple once you learn the rules. First, count the number of columns spanning the consolidation-breakout area, shown in a horizontal blue bar above. There are 21. Then, multiply that count by the box size and the reversal size: 21 x 10 x 3 = 630. Add this to the July 2010 low of 1010 on the S&P yields the target of 1640.
The consolidation phase, which began in February 2011 and has yet to be resolved to the up or downside, will also allow a count and a target. An upside breakout on the next column of Xs would yield a 1490 target, 8 x 10 x 3 + 1250. The target on a downside breakout would be 1160. To repeat, these targets are tentative since the pattern has yet to complete.
"The only true global macro play is the price of money, set by the US Central Bank."
Friday, May 6, 2011
Potential Three Day T

The chart above is a 15-min bar chart of the S&P emini futures over the last week. I have drawn a possible T construction whose right arm spans 3 days.
Two studies shown below the chart are of OBV and MFI. I am treating OBV as a proxy for the cash build up period. It has yet to break above the descending trendline but may do so.
To confirm this T, I am applying the Theorem I introduced last week. If the T is correctly constructed and viable, a peak in MFI should occur around the midpoint of the right arm of this 3 day T. I have marked this midpoint with a pink arrow. I am also taking this opportunity to test my Theorem in real time.
Thursday, May 5, 2011
Gold Correction Update II

In the chart above, GLD, the ETF for gold, briefly penetrated its trend line only to fall back below. I had given my reasons for predicting this behavior here. This brief penetration often happens in the terminal stages of an uptrend. This price structure therefore suggests that gold will correct.
As the anticipated correction develops, more clues will be given towards the area in which the correction will end. Tentatively, one possible target is the 50 week moving average, which is about 130 on GLD.
Wednesday, May 4, 2011
S&P 500 Intraday Bias, 10:10 AM
Negative but oversold
The S&P has already been down today as much as 12 points. My analysis suggests that the market will soon stage a sizable rally before this correction continues.
The S&P has already been down today as much as 12 points. My analysis suggests that the market will soon stage a sizable rally before this correction continues.
Tuesday, May 3, 2011
Saturday, April 30, 2011
S&P Projection – Flat
There’s often talk of whether the market will be heading up or down. Don’t forget sideways! My differentiated call is that the market may be in a period best characterized as range bound. The 1300 level may serve as the bottom end of the range; I’m not sure about the upper end yet, but we may be close. Here is what it would look like:

SPX is right at an RSI level of 70. The difference between a trending and non-trending market can be observed in RSI. If my thesis of a range bound market is correct, the 70 level should not be definitively surpassed.
The VIX (weekly bars) is now poking into the “old normal” levels last seen in 2007. The market may be getting duller.

Finally, below is a chart of the last eight months in which I have plotted the S&P 500 against Copper adjusted for the US Dollar’s valuation. The latter has been very weak, recently penetrating below its 200 day moving average! This divergence suggests that equities’ strength may falter.

Rahal's Theorem
Disclosure: My interpretation and analysis of T Theory ™ is entirely separate from that of founder, Terry Laundry and his T Theory ™ Foundation. To learn more about T Theory ™ visit ttheory.com
The following is a theorem I have constructed based on principles from T Theory ™ and Money Flow Ts ™ intending to resolve the two. As some of my older readers may know, I have explored the development of Ts spanning intraday or for slightly longer time frames. The following theorems will prove valuable in improving the reliability of shorter time frame Ts.
Theorem:
A T is a comprised of a centerpost, a right arm and a left arm (axiom)
The left arm is the cash buildup phase (axiom)
The right arm constitutes an uptrend (axiom)
A Money Flow T ™ is an uptrend whose midpoint is a peak in MFI (axiom)
Hence, a money flow T is the right arm of a T (theorem 1.)
Hence, a money flow T is equivalent in temporal-length to the left arm of a T (theorem 1.a.)
Hence, there is a peak in MFI at the midpoint of the right arm of a T (theorem 1.b.)
*
In other words, a Money Flow T ™ describes a property of the right arm of a T, namely, a peak in MFI at its midpoint.
*
One application of this theorem is that if one constructs a T in the traditional fashion, one would expect there to be a peak in MFI at the midpoint of the right arm. If there is a peak in MFI, this confirms the T construction. If there is no peak, then there is some misplacement in the left arm or the centerpost of the T.
Alternatively, if there are a couple of possible Money Flow T ™ constructions, one can extrapolate the left arm of a T for both constructions (theorem 1.a.) and see which one fits best into a cash build up period. Here is a step by step example of such a process:


Subscribe to:
Posts (Atom)

